Working of the Prototype
Landing Screen
Click on Sign In or Sign up
Sign In and Sign Up Screens
After entering the username and password, click sign-in.
Dashboard
-
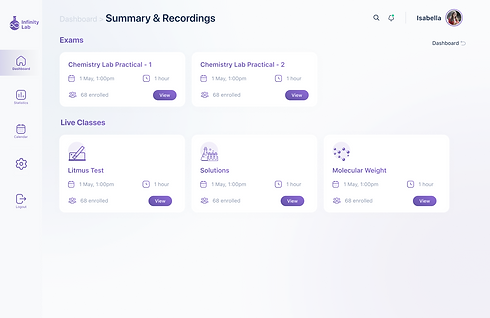
Once logging on to the website, the user will be directed to the dashboard. The dashboard has a side navigation bar with home, statistics, calendar, settings and logout icons. In addition, we have search, notifications, and the profile image on the top right.
-
Clicking on Live classes on the dashboard will direct you to the Live Classes screen. The user will be able to join the class by pressing the join button.
-
In the live classes, the primary options (mute, video on/off, share screen, end call) have been added. To the bottom right, we have the four options: virtual lab, chat, participants, and raise hands.
Practice Space
-
Open Dashboard, go to Practice Space. Select "Solutions" under experiments in the Practice Space Screen.
-
A brief description of the experiment is displayed. Now, click on "Practice Now".
-
The solutions experiment screen will display the steps in the practice
-
experiments. Now, take a beaker as shown in step 1.
-
Go to solutions and select the solution. We get an error message in choosing the wrong solution showing that you've picked the wrong solution.
-
Now take oxalic acid, and drag the conical flask to transfer 10 mL of the solution to the beaker.
-
Drag up to pour the solution and drag to put the solution down.
-
Now go-to solutions and take Potassium Permanganate solution to experiment.
-
Go to equipment and select a dropper. Drag it to the Potassium Permanganate solution.
-
Now drag the dropper to the oxalic acid solution and click on the dropper to add the Potassium Permanganate.
-
Now mix the solution following the directions.
-
Observe the color change. Click on the Readings tab to note the readings and
-
click"Save".
-
Click save, which will show the summary pop-up. Next, fill in the description and submit it to view the success pop-up.
Doubt Session
-
Press the "?" for help to schedule a doubt session. Then, click on schedule a doubt session.
-
Select the available professor and choose a time slot.
-
Finally, you get a confirmation after scheduling a doubt session.
Exam Space
-
Open Dashboard, go to Exam Space. Click on the start test in the Exam Space Screen. The current test is only highlighted. Other tests are faded and locked.
-
Click on "Start Now". There will be a short description of the exam, the duration of the test and the instructions. Then, click on "Next".
-
After clicking on "Next", a random generator will give an experiment to be performed by the student. Now click on "Start Test" to start the exam.
-
The student has got a litmus test experiment. Then, the virtual lab will open.
-
Firstly, click on the petri dish. Go to solutions and select Manganese 2+ to perform the pH test.
-
Next, go to the equipment and take a dropper. Drag it down to fill the dropper with the Manganese 2+ solution.
-
Now, drag it to the petri dish. Tap the dropper to fill the solution in the petri dish.
-
Tap the dropper to fill the solution in the petri dish.
-
Select equipment and click on pH paper. Drag the pH paper to dip it in the Manganese 2+ solution and observe the color change.
-
Click on readings to enter the substance and radio buttons for the color in litmus and whether the solution is acid or a base. Save the data.
-
After saving the data, a pop-up says to write a summary. Click on save.
-
When clicking on submit, there is a congratulations screen.
Summary & Readings
-
On clicking the "Summary & Recordings" card, it will display all the recorded values from the experiments and also show the summary written by the student.
-
On the left-hand side, we have the last segment of the experiment to remind the student that this was the color obtained when experimenting.
-
Then finally, there are the readings, summary, and the files and recordings of that lab session with the professor on the right-hand side.
Notifications
-
By pressing the notifications icon on the top right, a dropdown shows the newly added sessions and experiments.
Statistics
-
Click on statistics in the navigation bar.
-
This screen will show the statistics of their performance. The curve graph includes
-
the data of completed experiments and practice tests. The doughnut chart shows
-
the exam score data with accuracy, time, and correctness constraints.
Calendar
-
Clicking on the calendar button on the navigation bar, a grid view displays all the upcoming sessions and exams.
Help
-
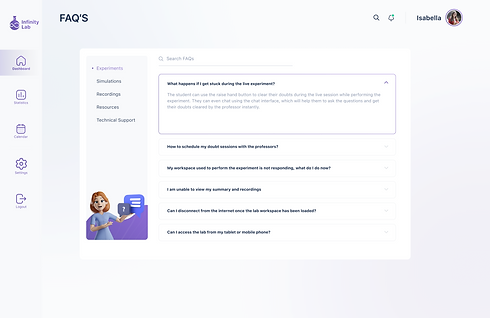
A dropdown shows settings, help and logout. Click on help which directs you to the screen.
Settings
-
Click on Settings in the navigation bar. The user can change their account details on this screen.
Logout
-
There is a dropdown by pressing the profile image on the top right of a list of options. Also, there is an icon in the navigation bar.


